The German hosting market 2026: Key providers and their brands at a glance
The German hosting market is characterised by a multitude of established providers competing for customers' favour. But …

You have not saved any offers or providers yet. Tap the bookmark on an offer or choose Save on a provider profile.
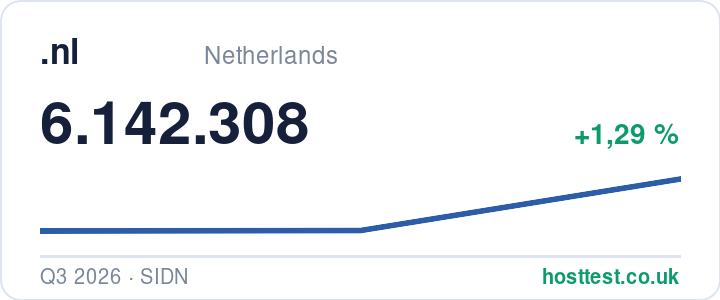
Registration figures for .nl as reported by SIDN, last updated for Q3 2026.
Put the chart on your own page as an image — the source is printed on it and the footer credits hosttest.
6.142.308
Regular yearly end-customer price for a .nl domain. We show a range rather than a single average, because the offers include different things — one number would suggest a precision the data does not carry.
* Based on 13 offers from 13 providers on a twelve-month term. Promotional and discounted prices are excluded, because they only apply in the first year. Compare all .nl offers
Further top-level domains in the data set. The offers column links to the price comparison where one exists for that extension.
| TLD | Region | Type | Offers |
|---|---|---|---|
| .de | Germany | ccTLD | compare |
| .at | Austria | ccTLD | compare |
| .ch | Switzerland | ccTLD | compare |
| .eu | Europe | ccTLD | compare |
| .com | Global | gTLD | compare |
| .net | Global | gTLD | compare |
| .uk | United Kingdom | ccTLD | compare |
| .fr | France | ccTLD | compare |
| .it | Italy | ccTLD | compare |
| .es | Spain | ccTLD | compare |
| .si | Slowenien | ccTLD | — |
| .pl | Polen | ccTLD | compare |
Selected articles from our editorial team on the domain market and registration figures.
The German hosting market is characterised by a multitude of established providers competing for customers' favour. But …
Which are the largest web hosting providers in Spain in terms of market share, usage distribution and search interest?
Which are the largest web hosts in the United Kingdom in terms of market share and search interest?
Which are the largest web hosts in Switzerland in terms of market share and search interest?
Which are Austria's largest web hosts in terms of market share and search interest?
The HOSTtest Domain Report shows how the most important domain extensions have changed compared with the previous quarte…
All figures come from the official publications of the responsible registries and are checked and entered by hand every quarter. Every data point carries its source.
Registries count differently: depending on the operator, "registered" domains may include those in transfer or cancellation periods. Comparisons between TLDs should therefore be read as orders of magnitude. Population figures are used solely for the per-capita calculation.
Could not save. Please allow cookies for this website or remove entries if your bookmark list is full.